I’ve been paying with visualisations using p5.js for the one pixel camera project.
With the data streaming from processing to the phant setup, we can easily pull various sets of data as json to feed into p5.js sketches. This makes the visualisation easy enough to be fun, because it removes a lot of the faff associated with moving data around. The docs on phant.io give a decent overview of the different cuts of the data you can pull directly.
This is a really simple visualisation – it just pulls a recent data set and plots a pixel for each second – seconds on columns, minutes on rows – in whichever order they arrive.
https://stevenmilne.com/assets/js/index.html
I like how it goes a bit glitchy when the pixel capture fails for a few seconds, or when the data set spans more than a single hour and it overwrites itself.
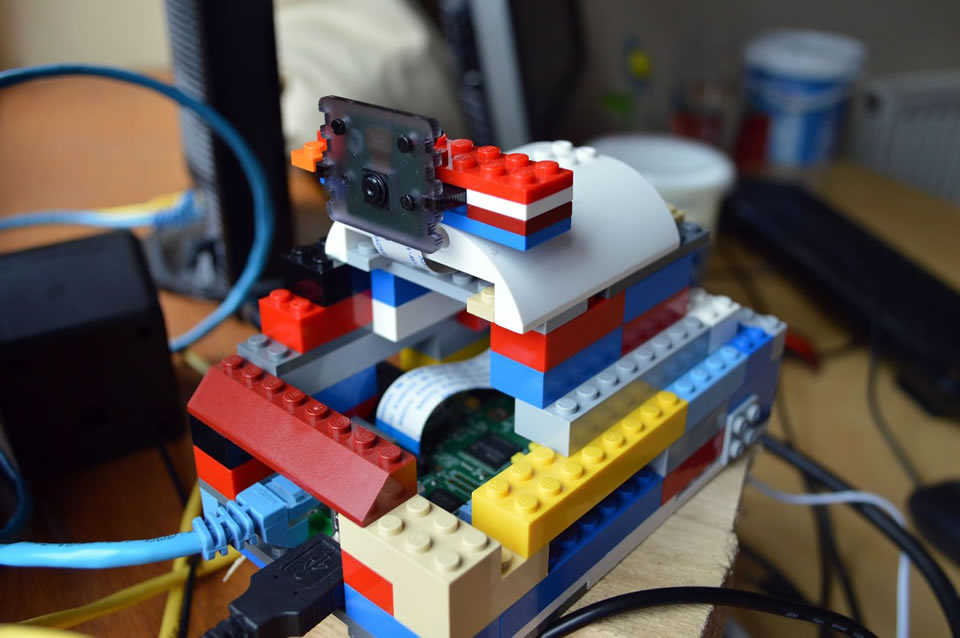
Next up – getting the pixel stream to come from this little monkey instead of the Mac. RPi + Lego = Huzzah.